
Workforce
The people who know how it's done are leaving
The aging industrial workforce is a knowledge problem first and a hiring problem second. When your best estimator or machinist leaves, the job can be refilled. How they did it usually can't, because it was never written down. We pulled the federal data on the roles that carry that know-how: how old the people in them are, and how fast they leave.

Gary O'Neill, Founder & CEO, Setanta.
6 min read
Key findings
55
About one in three machinists, cost estimators and maintenance supervisors in the US is 55 or older. Across all workers it is 23.2%. (BLS, 2025)
9%
Welders and dispatchers are younger than average, but they leave too. BLS projects that about 9% of welders leave the occupation every year through 2035, mostly for other kinds of work.
3
For every role in Chart 3, almost every projected opening exists to replace someone who left, not because the job is growing.
Why we looked
Most industrial companies we talk to have one person everyone walks over to. The estimator who knows which jobs lose money. The machinist who can hear a bad setup before the first part is cut. The inside sales rep who knows which customer will take a substitute grade and which one will send the truck back. When we ask where that knowledge is written down, we usually get a laugh.
So we asked two plain questions. How old are the people in those seats? And how many of them leave each year? We used two public sources from the Bureau of Labor Statistics: the Current Population Survey (CPS) 2025 annual averages, Table 11b, and the Employment Projections table of occupational separations for 2025 to 2035.
How old are the people who hold the know-how?
Table 11b counts employed people by detailed occupation and age. We took the roles that carry most of the know-how in a mid-sized industrial company and computed the share aged 55 and older.
All employed people, 23.2
| Role (CPS title) | Employed (thousands) | Aged 55 to 64 | Aged 65+ | Share 55+ | Median age |
|---|---|---|---|---|---|
| Bookkeeping, accounting, and auditing clerks | 1,254 | 332 | 169 | 40.0% | 49.8 |
| First-line supervisors of mechanics, installers, and repairers | 285 | 80 | 12 | 32.3% | 47.6 |
| Machinists | 309 | 77 | 20 | 31.4% | 45.7 |
| Cost estimators | 146 | 28 | 17 | 30.8% | 45.5 |
| Sales representatives, wholesale and manufacturing | 1,145 | 208 | 84 | 25.5% | 44.2 |
| First-line supervisors of production and operating workers | 749 | 159 | 30 | 25.2% | 44.4 |
| All employed people | 163,493 | 26,605 | 11,374 | 23.2% | 42.1 |
| Production, planning, and expediting clerks | 212 | 36 | 10 | 21.7% | 41.9 |
| Welding, soldering, and brazing workers | 573 | 96 | 20 | 20.2% | 39.3 |
| Dispatchers, except police, fire, and ambulance | 180 | 20 | 10 | 16.7% | 40.6 |
Two things stand out. The roles that price, plan and fix the work skew older than the workforce as a whole. The roles on the floor and at the dispatch board skew younger. We expected the first. The second surprised us, and it matters for the next section.
A few notes on the data. CPS is a household survey, so small occupations carry wider error. BLS says its 2025 annual figures are 11-month averages, because October 2025 data were not collected during the federal shutdown. CPS has no separate "inside sales" title, so we use wholesale and manufacturing sales representatives as the closest match. These are all US workers in each role, not only those in industrial companies.
How many of them leave each year?
Age tells you who might retire. It doesn't tell you who leaves. For that, BLS projects occupational separations: people who leave the labor force entirely, "due to retirement or other reasons," and people who move into a different occupation.
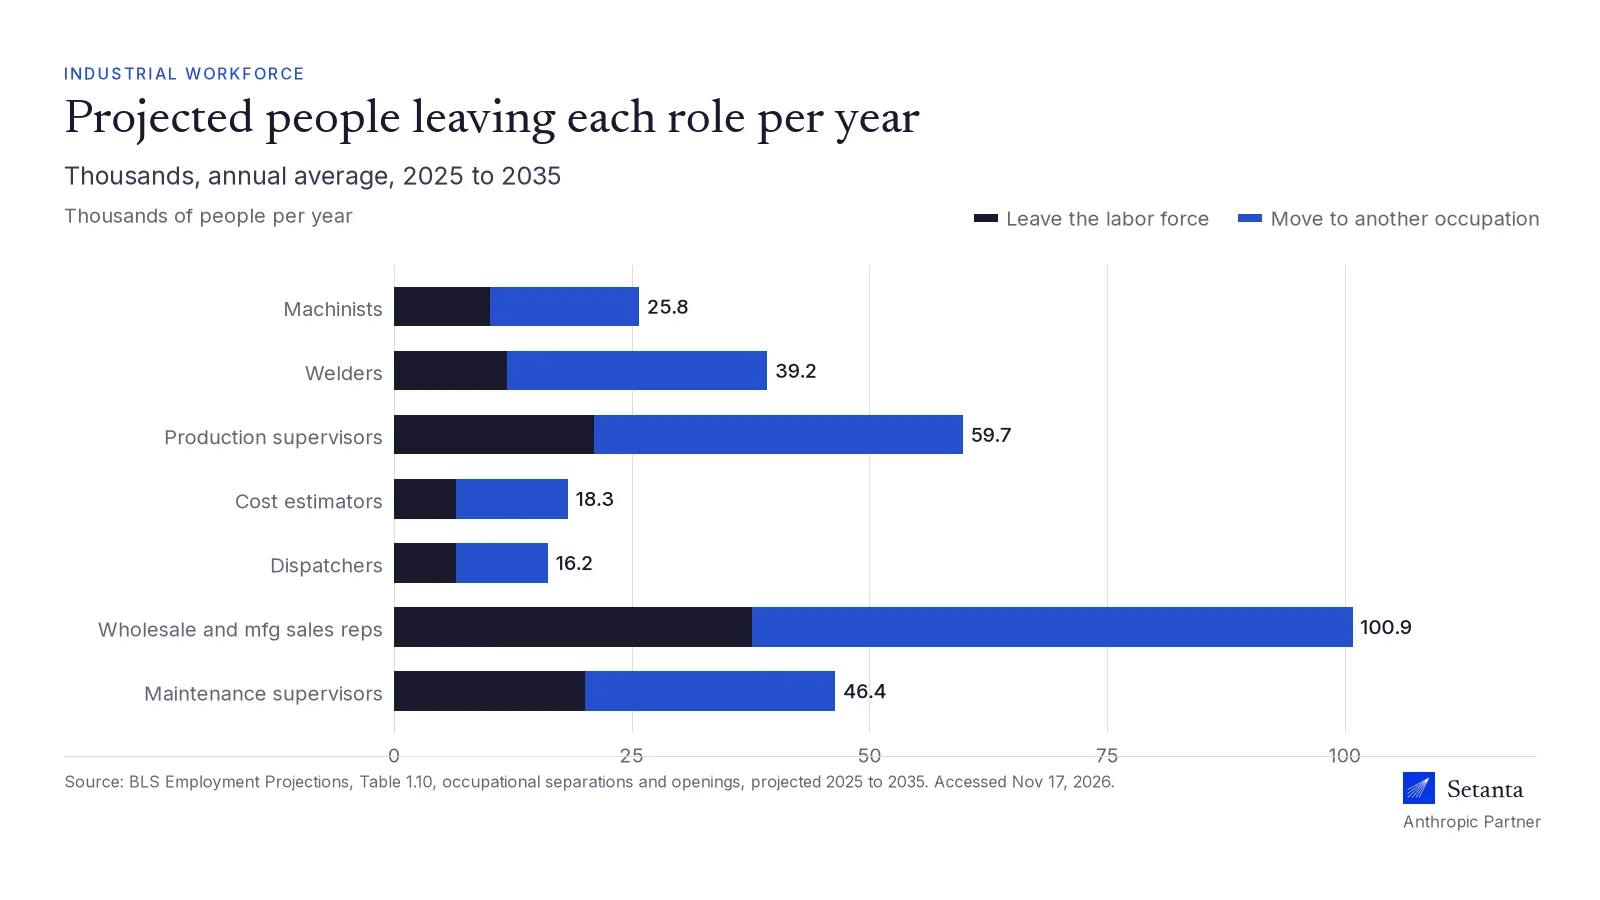
| Role (BLS projections title) | Employment, 2025 | Leave the labor force | Move to another occupation | Total separations | Separation rate |
|---|---|---|---|---|---|
| Machinists | 288.3 | 10.1 | 15.7 | 25.8 | 8.9% |
| Welders, cutters, solderers, and brazers | 437.7 | 11.9 | 27.3 | 39.2 | 8.9% |
| First-line supervisors of production and operating workers | 679.9 | 21.0 | 38.8 | 59.7 | 8.7% |
| Cost estimators | 226.4 | 6.5 | 11.8 | 18.3 | 8.2% |
| Dispatchers, except police, fire, and ambulance | 203.5 | 6.5 | 9.7 | 16.2 | 8.0% |
| Sales representatives, wholesale and manufacturing, except technical and scientific products | 1,279.4 | 37.7 | 63.1 | 100.9 | 7.9% |
| First-line supervisors of mechanics, installers, and repairers | 629.0 | 20.1 | 26.3 | 46.4 | 7.2% |
Both groups leave, through different doors. Machinists skew older, and BLS projects a larger share of them leaving the labor force each year than welders, 3.5% against 2.7%. Welders skew younger and leave for other work: BLS projects 27,300 welders a year moving to a different occupation, more than twice the number leaving the labor force. Either way, the person who knew how your shop does it is gone, and so is whatever they never wrote down.
Put the machinist numbers side by side and the scale is clear. Projected separations add up to about 258,000 over the decade, close to the size of the whole occupation today, 288,300. That is our arithmetic, and it overstates how many different people leave, since a newer hire can leave too. It still means the seat turns over far more often than most owners assume.
Is the work growing, or just turning over?
| Role | Openings per year (thousands) | Employment change over the decade (thousands) | Openings that replace someone who left |
|---|---|---|---|
| Machinists | 26.1 | +3.0 | 25.8 of 26.1 |
| Welders, cutters, solderers, and brazers | 40.3 | +10.3 | 39.2 of 40.3 |
| Cost estimators | 17.6 | -6.9 | All, as employment shrinks |
| Dispatchers, except police, fire, and ambulance | 16.0 | -1.5 | All, as employment shrinks |
| Sales representatives, wholesale and manufacturing, except technical | 99.8 | -11.2 | All, as employment shrinks |
| First-line supervisors of production and operating workers | 61.0 | +12.4 | 59.7 of 61.0 |
| First-line supervisors of mechanics, installers, and repairers | 48.9 | +25.5 | 46.4 of 48.9 |
Mostly turning over. Every year, companies hire new people into seats whose know-how left with the last person, and the new hire rebuilds it by trial and error.
What should an owner do with this?
Hiring fills the seat. It doesn't fill it with the old know-how. The fix we keep coming back to is simple and a little unglamorous: write down how your best person does the job, then make it usable by everyone else.
- Pick one role. The one where a single retirement or resignation would hurt most. Often it is the estimator or the inside sales lead.
- Sit with the best person on 20 real jobs. Ask why at every decision. Which customers get which price. Which jobs they walk away from. What they check twice.
- Write the rules and the exceptions down. Plain language, in their words.
- Put it where Claude can read it, next to their past quotes, jobs or tickets, so a newer person gets a draft that reflects how the best person would do it.
- Keep a person approving anything that changes a price, a promise date or a customer commitment.
We'd rather you do this with a notebook than not at all. Claude makes it faster to capture and much easier to use every day. If you want help finding which seat to start with, our free Operating Diagnostic begins there. We are an Anthropic Partner, and we measure on your numbers.
Questions we hear
How old is the average machinist in the US?
The median age of employed machinists was 45.7 in 2025, against 42.1 for all workers, and 31.4% were 55 or older (BLS CPS, Table 11b).
Are welders retiring faster than other workers?
No. Welders are younger than average, with a median age of 39.3. BLS projects they leave mainly by moving to other occupations, about 27,300 a year through 2035.
How do you keep know-how when an experienced employee retires?
Start before they leave. Sit with them on real work, write down how they decide, and keep it next to their past work so the next person can use it. A person still approves anything that touches price or a customer.
Sources
Methodology
Chart 1 and its table. Source: BLS CPS 2025 annual averages, Table 11b. Share 55+ is our arithmetic: (55 to 64 plus 65+) divided by total.
Chart 2 and its table. Source: BLS Employment Projections, Table 1.10, 2025 to 2035. BLS employment counts come from a different survey than CPS, so they will not match Chart 1. The separation rates are BLS's own, measured against average employment over the decade, not 2025 employment.
Chart 3. Source: BLS Employment Projections, Table 1.10. BLS openings equal separations plus one tenth of the decade's employment change.
Gary O'Neill is the founder of Setanta, an Anthropic Partner that modernizes US industrial businesses.
Where would this show up in your business?
The Operating Diagnostic looks at how your team works today and where Claude would move your numbers first.