
Report · October 2026 edition
State of AI by State: who pays for AI, and who uses Claude most.
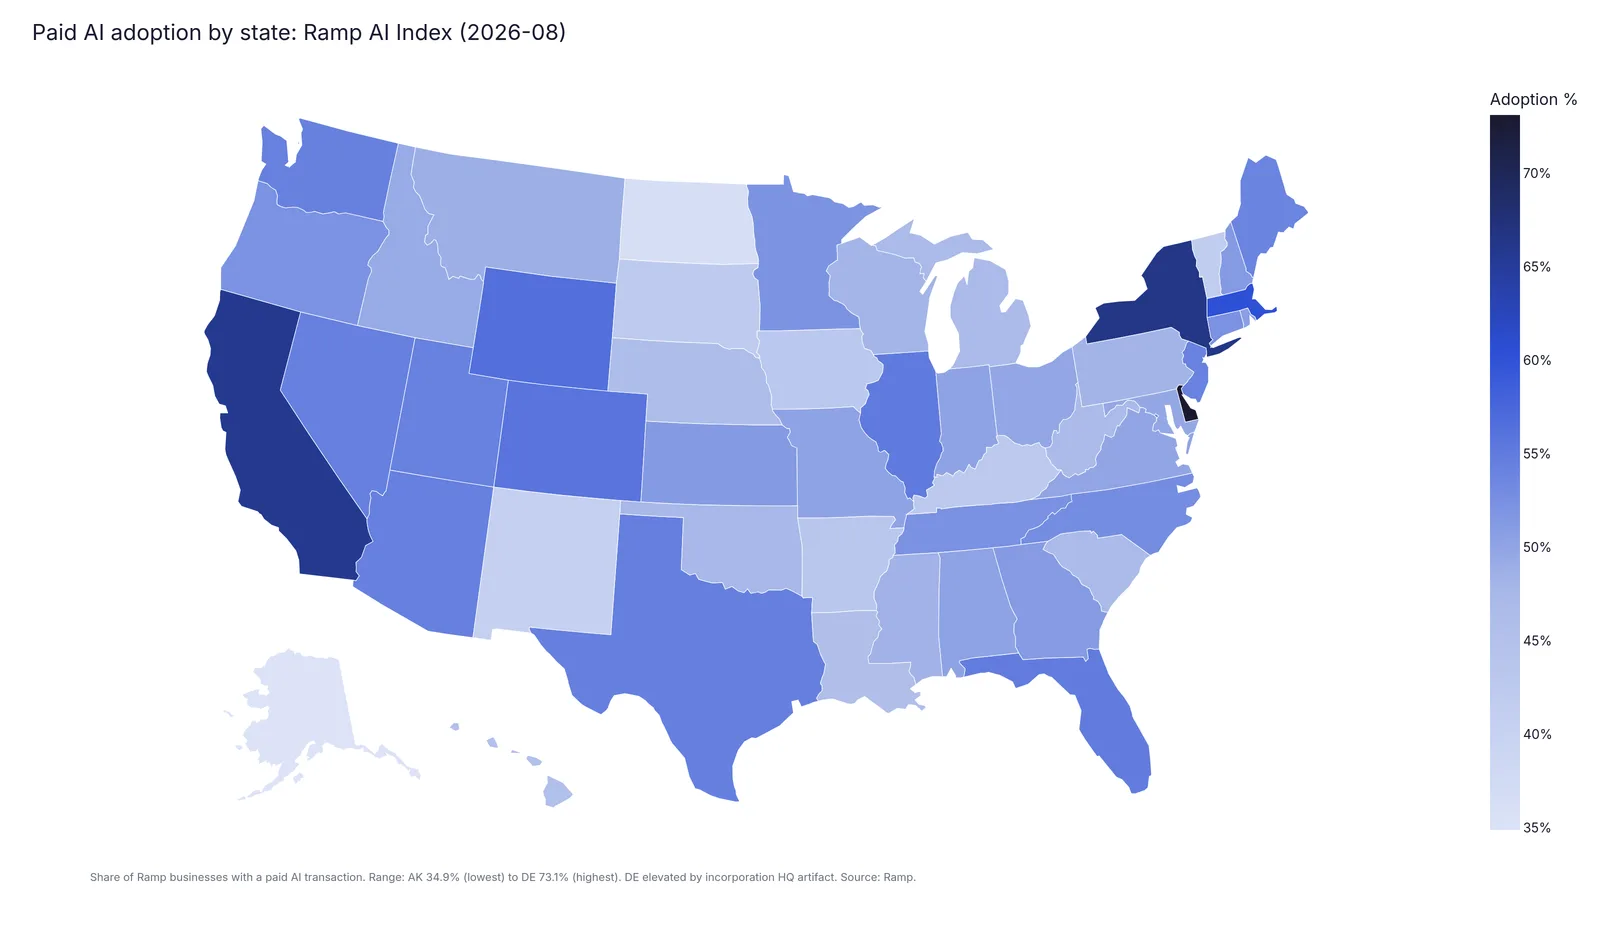
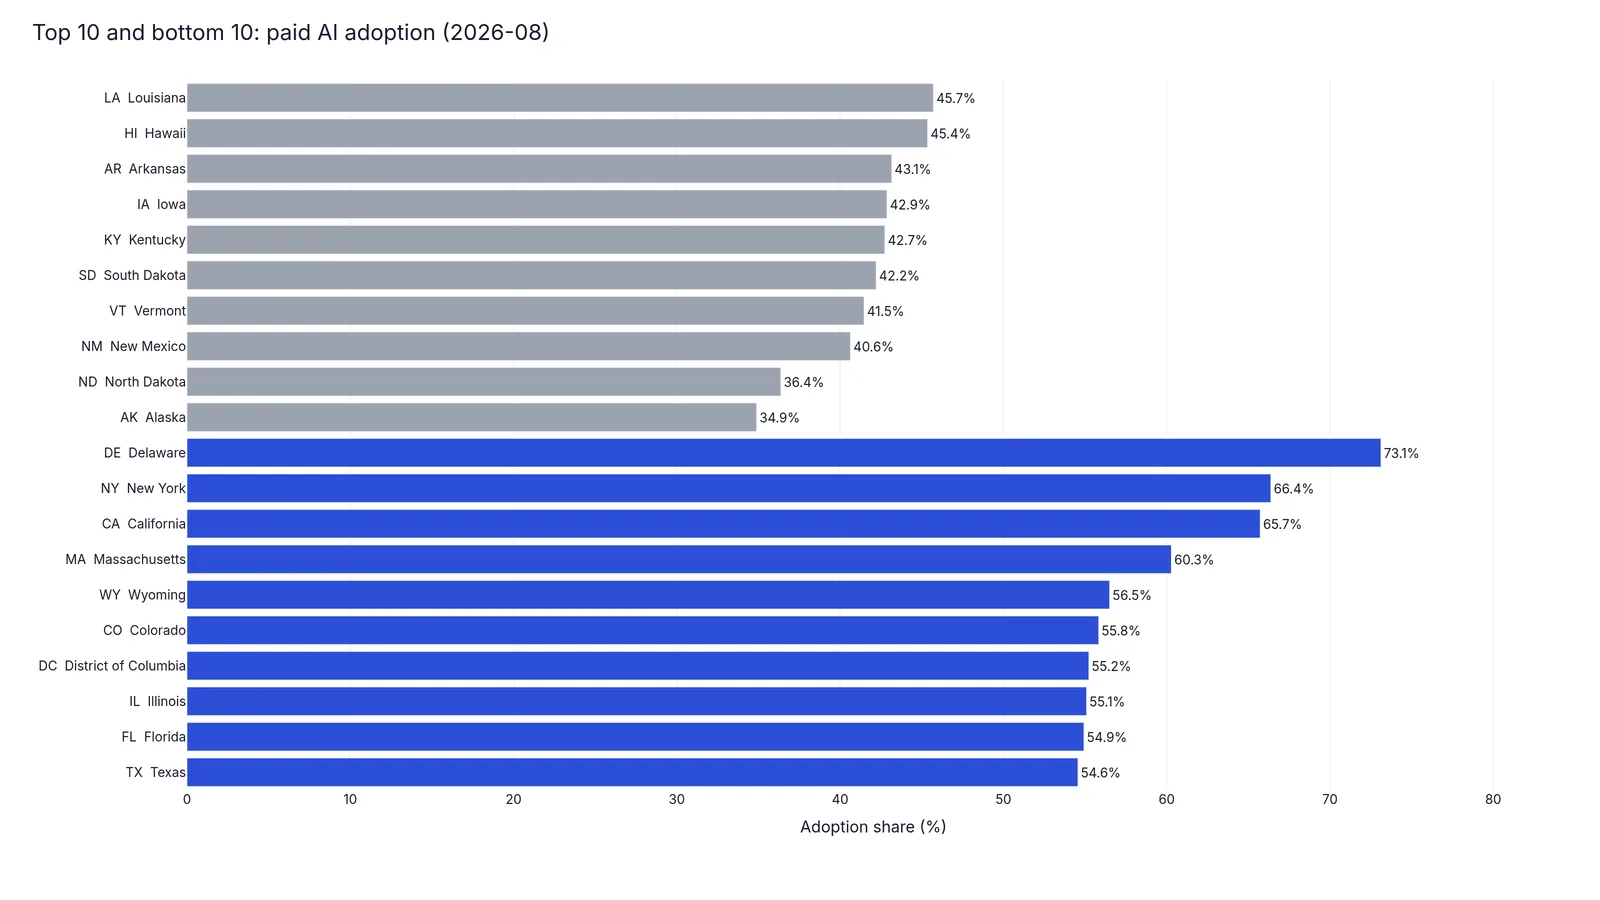
Paid AI adoption stood at 56.13% of Ramp businesses nationally in August 2026. By state it ranges from 34.88% in Alaska to 73.12% in Delaware, with a median of 50.31%. This page ranks all 50 states and DC, shows the seven US Southeast states Setanta serves, and gives the data.
Every state, at a glance.
Pick a measure. Point at a state.
- under 45%
- 45 to 50%
- 50 to 55%
- 55 to 60%
- 60% and up
Data period
Ramp, August 2026. Anthropic, a year earlier.
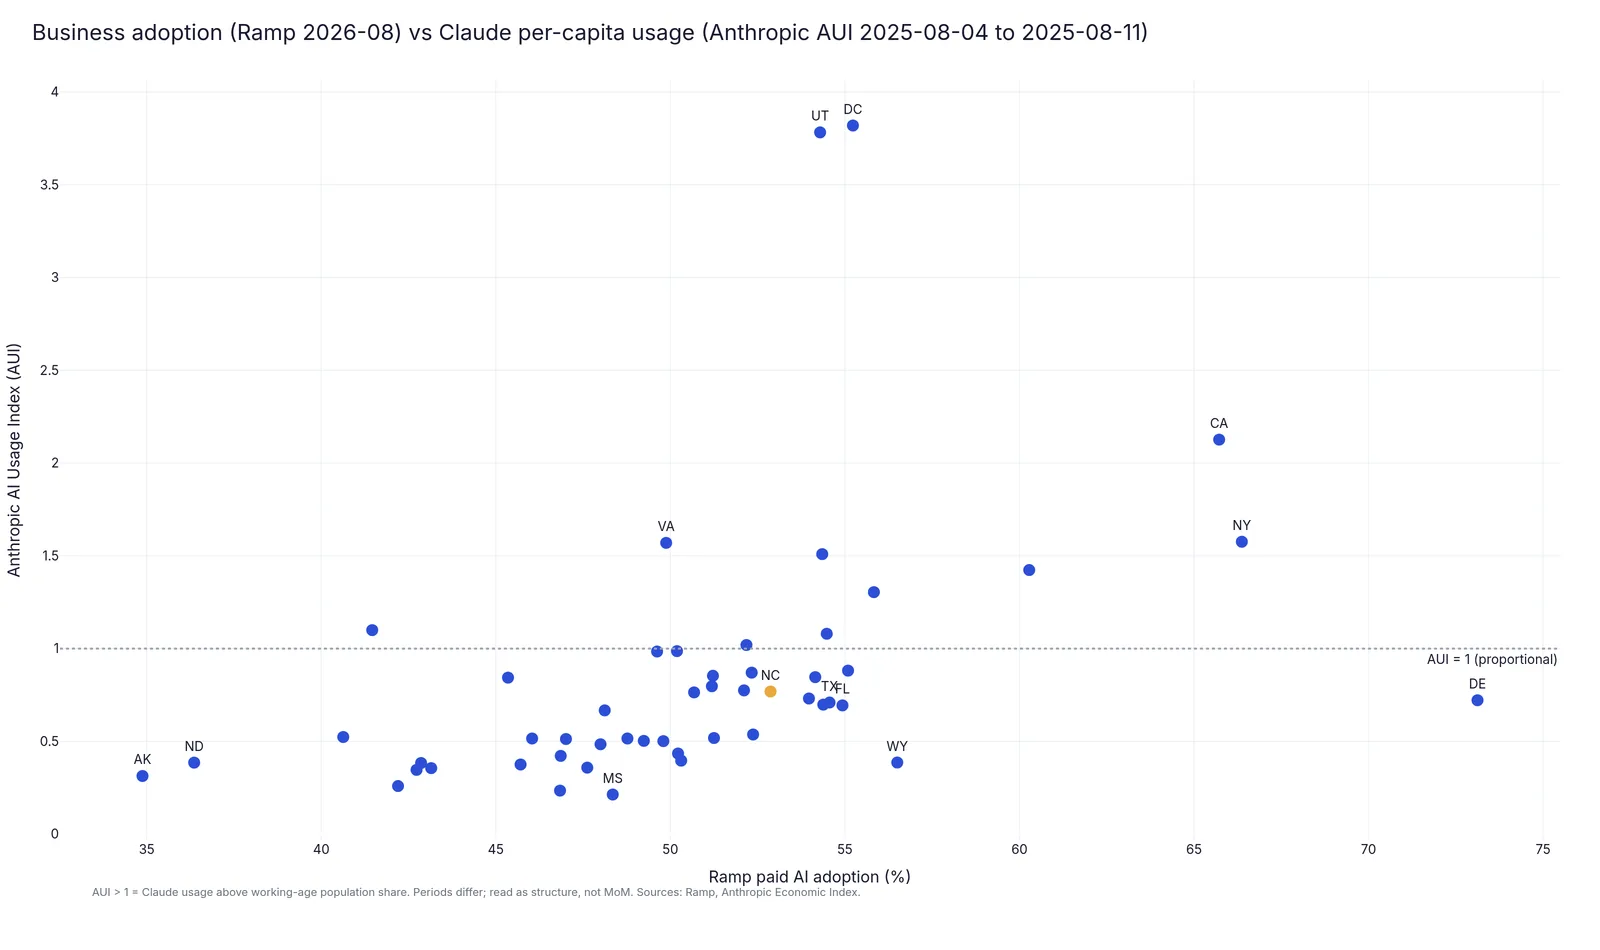
Two public sources, two different periods. Ramp AI Index data is for August 2026 (latest month on its public dashboard when we pulled it on October 5, 2026), with changes against July 2026. The Anthropic AI Usage Index covers August 4 to 11, 2025, so the two are not month-matched.
- National paid AI adoption
56.13%
National paid AI adoption
+0.42 pp on July and +11.15 pp on a year earlier. Ramp AI Index.
- Median state
50.31%
Median state
Across 50 states and DC. Range 34.88% to 73.12%.
- States above the national figure
5 of 51
States above the national figure
Counting DC.
What stands out
Five things the numbers show, and one caution.
- The leaders
- Delaware (73.12%), New York (66.37%) and California (65.72%) lead. Delaware has a sample of 733 businesses, and it is a common state of incorporation, so read its number carefully.
- The largest gains
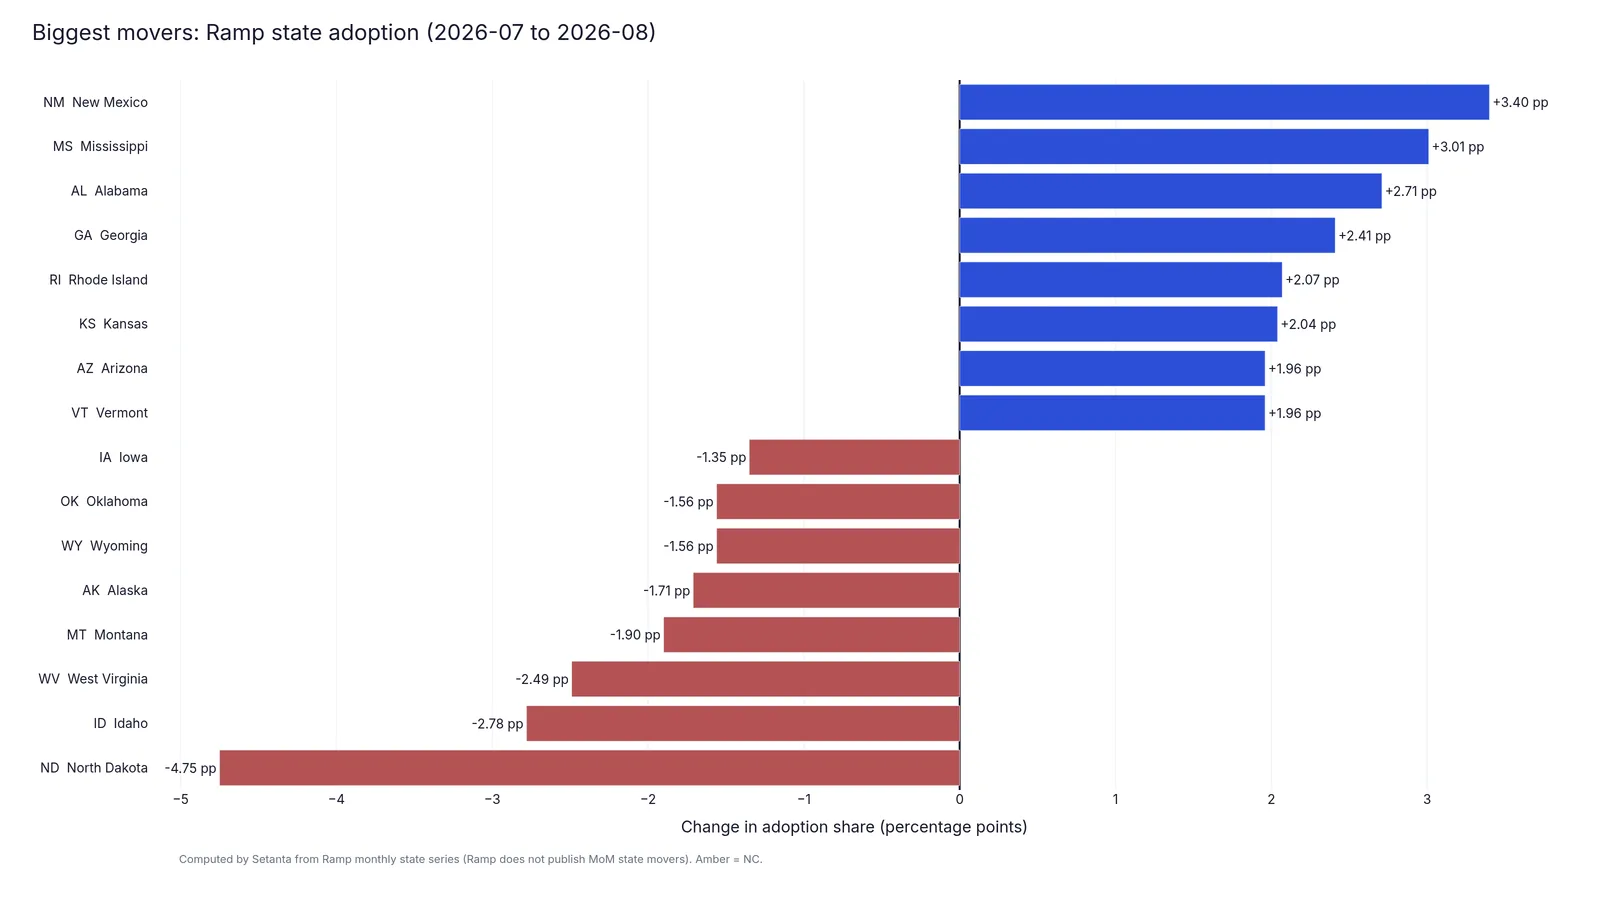
- New Mexico, Mississippi, Alabama, Georgia and Rhode Island posted the five largest gains from July to August, from +3.40 pp to +2.07 pp. Alabama and Georgia are in the US Southeast.
- The largest drops
- North Dakota, Idaho, West Virginia and Montana fell the most, from -4.75 pp to -1.90 pp. Each has a Ramp sample of 331 businesses or fewer, and small samples swing more from month to month.
- The most Claude use per person
- District of Columbia (3.82), Utah (3.78) and California (2.13) have the highest Anthropic usage index. A value of 1.00 is parity with working-age population share. 11 of 51 are at or above it.
- The two measures differ
- Delaware leads on Ramp adoption and has a usage index of 0.72. District of Columbia leads on usage and ranks #7 on adoption. Paying for seats and using Claude heavily are different things.
- The caution
- Ramp's sample is businesses that use Ramp, which skews toward firms that are already digital. Free tools and personal accounts do not show up. Nothing here is a census.
The US Southeast
The seven states Setanta serves, ranked.
North Carolina, South Carolina, Georgia, Florida, Tennessee, Virginia and Alabama. Setanta is based in Wilmington, NC.
| Rank | State | Paid AI adoption | Change since July | Ramp sample | Claude usage index |
|---|---|---|---|---|---|
| #9 | Florida | 54.93% | +0.09 pp | 4,378 | 0.69 |
| #17 | North Carolina | 52.87% | +1.54 pp | 1,844 | 0.77 |
| #18 | Tennessee | 52.37% | +1.45 pp | 1,310 | 0.54 |
| #24 | Georgia | 51.19% | +2.41 pp | 1,717 | 0.80 |
| #26 | Alabama | 50.31% | +2.71 pp | 636 | 0.40 |
| #29 | Virginia | 49.88% | +0.60 pp | 1,614 | 1.57 |
| #39 | South Carolina | 46.86% | +0.89 pp | 717 | 0.42 |
Charts
The same data, drawn.
All 51 rows
Every state and DC, ranked on paid adoption.
Rank is Setanta's, computed from Ramp's state series, because Ramp does not publish ranks. DC is counted as a state.
| Rank | State | Paid AI adoption | Change since July | Ramp sample | Claude usage index |
|---|---|---|---|---|---|
| #1 | Delaware | 73.12% | +0.06 pp | 733 | 0.72 |
| #2 | New York | 66.37% | -0.19 pp | 5,655 | 1.58 |
| #3 | California | 65.72% | +0.19 pp | 10,978 | 2.13 |
| #4 | Massachusetts | 60.28% | +1.23 pp | 1,921 | 1.42 |
| #5 | Wyoming | 56.50% | -1.56 pp | 200 | 0.39 |
| #6 | Colorado | 55.83% | -0.64 pp | 1,800 | 1.30 |
| #7 | District of Columbia | 55.23% | +0.44 pp | 650 | 3.82 |
| #8 | Illinois | 55.09% | +1.29 pp | 2,013 | 0.88 |
| #9 | Florida | 54.93% | +0.09 pp | 4,378 | 0.69 |
| #10 | Texas | 54.56% | +1.07 pp | 5,927 | 0.71 |
| #11 | Nevada | 54.48% | +1.03 pp | 580 | 1.08 |
| #12 | Arizona | 54.38% | +1.96 pp | 1,131 | 0.70 |
| #13 | Washington | 54.35% | -0.13 pp | 1,461 | 1.51 |
| #14 | Utah | 54.29% | -0.26 pp | 1,153 | 3.78 |
| #15 | New Jersey | 54.15% | +0.47 pp | 1,385 | 0.85 |
| #16 | Maine | 53.97% | +0.32 pp | 239 | 0.73 |
| #17 | North Carolina | 52.87% | +1.54 pp | 1,844 | 0.77 |
| #18 | Tennessee | 52.37% | +1.45 pp | 1,310 | 0.54 |
| #19 | Connecticut | 52.33% | +0.70 pp | 665 | 0.87 |
| #20 | Oregon | 52.18% | +0.09 pp | 734 | 1.02 |
| #21 | Minnesota | 52.11% | +0.78 pp | 971 | 0.77 |
| #22 | Kansas | 51.25% | +2.04 pp | 400 | 0.52 |
| #23 | New Hampshire | 51.22% | +0.67 pp | 287 | 0.85 |
| #24 | Georgia | 51.19% | +2.41 pp | 1,717 | 0.80 |
| #25 | Rhode Island | 50.68% | +2.07 pp | 146 | 0.76 |
| #26 | Alabama | 50.31% | +2.71 pp | 636 | 0.40 |
| #27 | Indiana | 50.22% | +0.86 pp | 894 | 0.43 |
| #28 | Missouri | 50.19% | +1.17 pp | 803 | 0.99 |
| #29 | Virginia | 49.88% | +0.60 pp | 1,614 | 1.57 |
| #30 | Ohio | 49.80% | -0.82 pp | 1,275 | 0.50 |
| #31 | Maryland | 49.62% | +0.88 pp | 911 | 0.98 |
| #32 | Idaho | 49.24% | -2.78 pp | 331 | 0.50 |
| #33 | Montana | 48.77% | -1.90 pp | 244 | 0.52 |
| #34 | Mississippi | 48.35% | +3.01 pp | 242 | 0.21 |
| #35 | Pennsylvania | 48.12% | +0.21 pp | 1,567 | 0.67 |
| #36 | Wisconsin | 48.00% | +0.66 pp | 675 | 0.48 |
| #37 | Oklahoma | 47.62% | -1.56 pp | 588 | 0.36 |
| #38 | Michigan | 47.01% | -0.80 pp | 1,170 | 0.51 |
| #39 | South Carolina | 46.86% | +0.89 pp | 717 | 0.42 |
| #40 | West Virginia | 46.84% | -2.49 pp | 79 | 0.23 |
| #41 | Nebraska | 46.04% | -1.00 pp | 278 | 0.52 |
| #42 | Louisiana | 45.71% | +0.85 pp | 385 | 0.38 |
| #43 | Hawaii | 45.35% | +0.95 pp | 258 | 0.84 |
| #44 | Arkansas | 43.15% | -0.33 pp | 292 | 0.36 |
| #45 | Iowa | 42.86% | -1.35 pp | 350 | 0.38 |
| #46 | Kentucky | 42.73% | +0.16 pp | 461 | 0.35 |
| #47 | South Dakota | 42.20% | +0.85 pp | 109 | 0.26 |
| #48 | Vermont | 41.46% | +1.96 pp | 123 | 1.10 |
| #49 | New Mexico | 40.63% | +3.40 pp | 192 | 0.52 |
| #50 | North Dakota | 36.36% | -4.75 pp | 99 | 0.39 |
| #51 | Alaska | 34.88% | -1.71 pp | 86 | 0.31 |
Methodology and sources
What each number is, and where it comes from.
- Paid AI adoption
- From the Ramp AI Index: the share of Ramp businesses in the state with a paid AI transaction in the month. Ramp's sample is customers on its card and bill-pay platform, not a random draw of all businesses. Data period August 2026.
- Change since July
- August adoption minus July adoption, in percentage points, from Ramp's state series. Computed by Setanta. Ramp does not publish this table.
- Rank
- Position among 50 states and DC on August adoption, highest first. Computed by Setanta. Last month's rank uses July adoption the same way.
- Ramp sample
- Ramp businesses in the state in the data month. Small samples make monthly changes less reliable.
- Claude usage index
- The Anthropic AI Usage Index: how Claude.ai usage in a state compares with its share of working-age population, where 1.00 is parity. From the Anthropic Economic Index public release of 2025-09-15, window August 4 to 11, 2025, Free and Pro accounts only. Not month-matched with Ramp.
- National figure
- 56.13% for August 2026, from Ramp's national series on the same dashboard.
Sources. Ramp AI Index and Anthropic Economic Index. Both are public. Setanta did not collect either dataset.
Caveats. Ramp captures paid transactions only, so free tools and personal accounts are invisible. Delaware is a common state of incorporation, which may inflate its figure. The Anthropic window is a year older than the Ramp data and covers consumer plans. States with small samples move more from month to month. Ranks and monthly changes are our arithmetic, not Ramp's or Anthropic's.
Edition. October 2026. A new edition replaces this one as Ramp publishes new months.
Questions
Questions about the data.
Which state has the highest AI adoption?
On the Ramp AI Index for August 2026, Delaware leads at 73.12% of Ramp businesses with a paid AI transaction, from a sample of 733. New York (66.37%) and California (65.72%) follow. Alaska is lowest at 34.88%.
What is the Ramp AI Index?
A public index from Ramp of the share of businesses on its card and bill-pay platform that made a paid AI transaction in a month. It misses free tools, personal accounts and firms outside Ramp, so it measures paid business adoption among Ramp customers. It is not a census of all companies.
What is the Anthropic AI Usage Index?
A measure from the Anthropic Economic Index of how Claude.ai usage in a state compares with its share of working-age population. A value of 1.00 means parity, above it means more use than population share. The window used here is August 4 to 11, 2025, covering Free and Pro accounts.
Why do the two measures disagree?
They measure different things in different periods. Ramp counts paid business transactions in August 2026. The Anthropic index covers Claude.ai consumer plans in August 2025. Delaware is first on Ramp and has a usage index of 0.72, while District of Columbia leads on usage at 3.82.
Where does North Carolina rank?
North Carolina ranks #17 of 51 at 52.87%, up 4 places since July. Setanta is based in Wilmington, NC. The full table, including the other six US Southeast states we serve, is on this page.
What is the free Operating Diagnostic?
A free call (book a time) that looks at how your team works today. It finds where Claude would move your numbers first and the process worth fixing first, and says which package fits. If it is not the right time, we say so.
Your state number is context. Your own workflow is the point.
The Operating Diagnostic is free. It finds where Claude would move your numbers first.