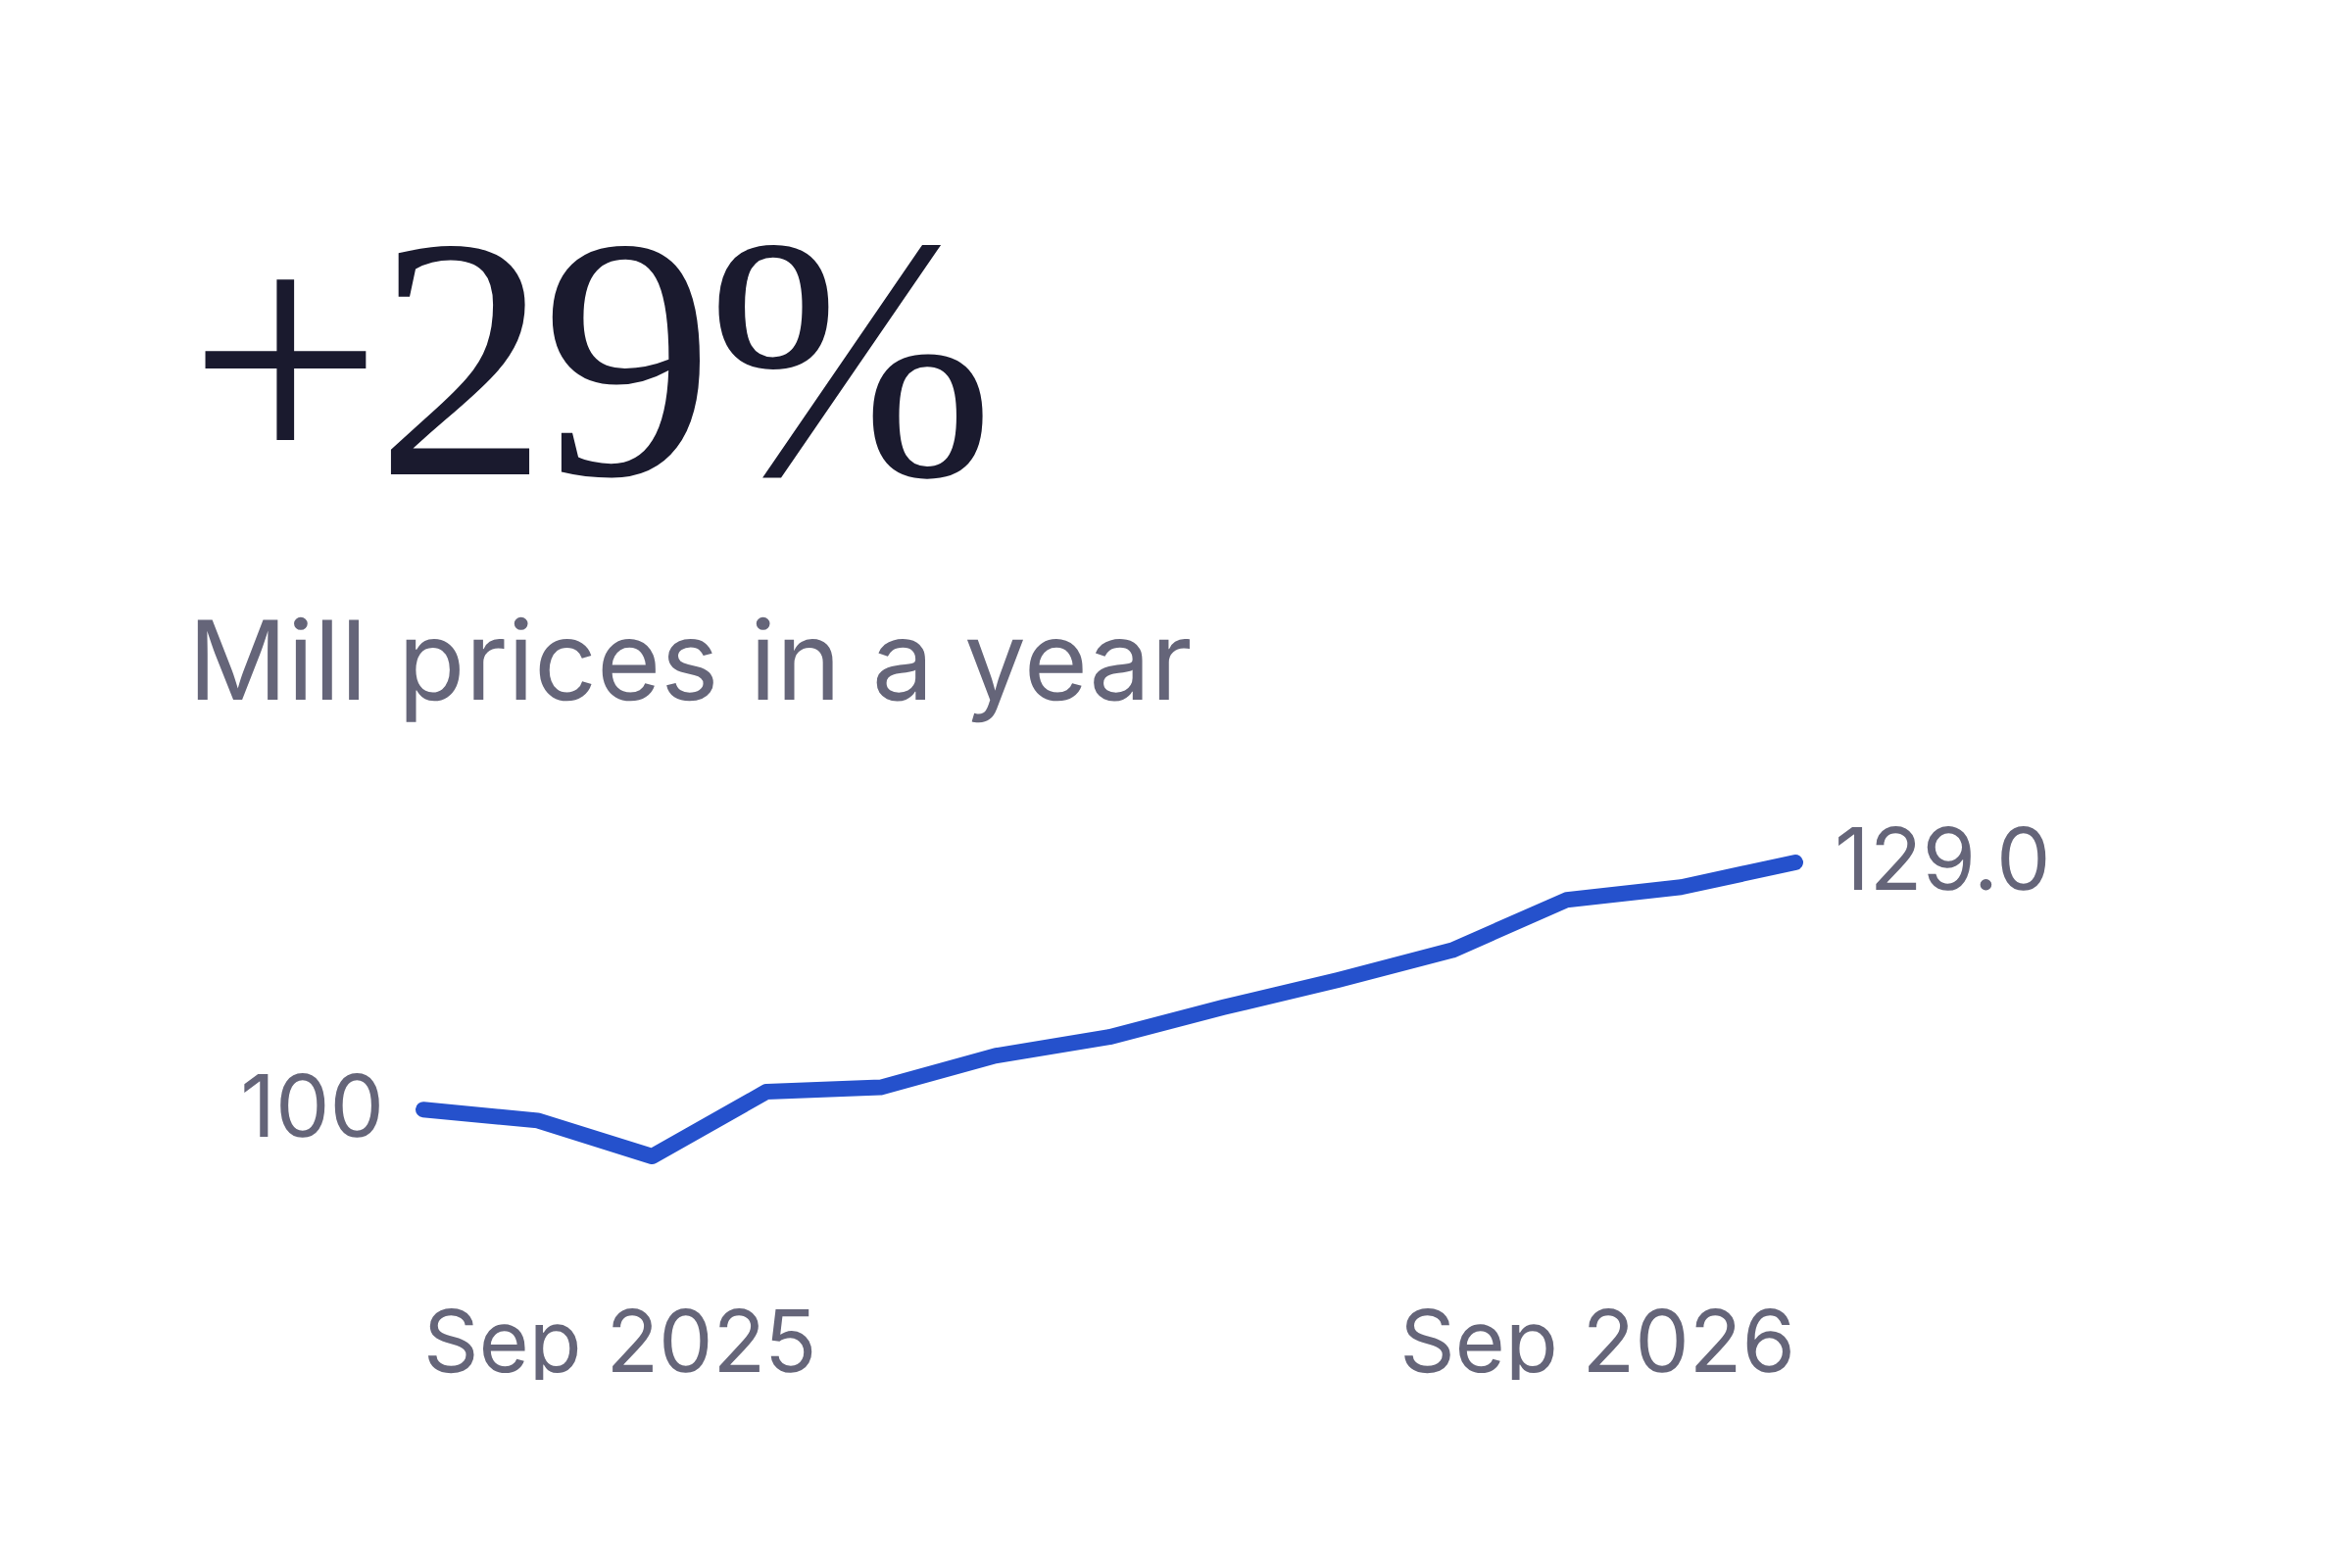
Why the order desk is the bottleneck.
Nine states hold about one in five US service center and fabricator sites, in an industry that cites labor shortages more than the rest of manufacturing.

Last updated Data as of 9 min read
Service center and fabricator sites by state, nine states, 2023.
- Metal service centers (NAICS 423510)
- Structural steel fabricators (NAICS 332312)
Florida
Service centers 486. Fabricators 173.
Georgia
Service centers 254. Fabricators 94.
North Carolina
Service centers 245. Fabricators 102.
Alabama
Service centers 157. Fabricators 107.
Tennessee
Service centers 152. Fabricators 85.
Virginia
Service centers 109. Fabricators 69.
South Carolina
Service centers 110. Fabricators 53.
Kentucky
Service centers 104. Fabricators 45.
Mississippi
Service centers 46. Fabricators 33.
In short
- Nine states hold 1,663 service center sites and 761 fabricator sites, about one in five in the US (Census CBP 2023).
- Firms with 50 to 499 people employ about a third of the workers in both industries (Census SUSB 2022).
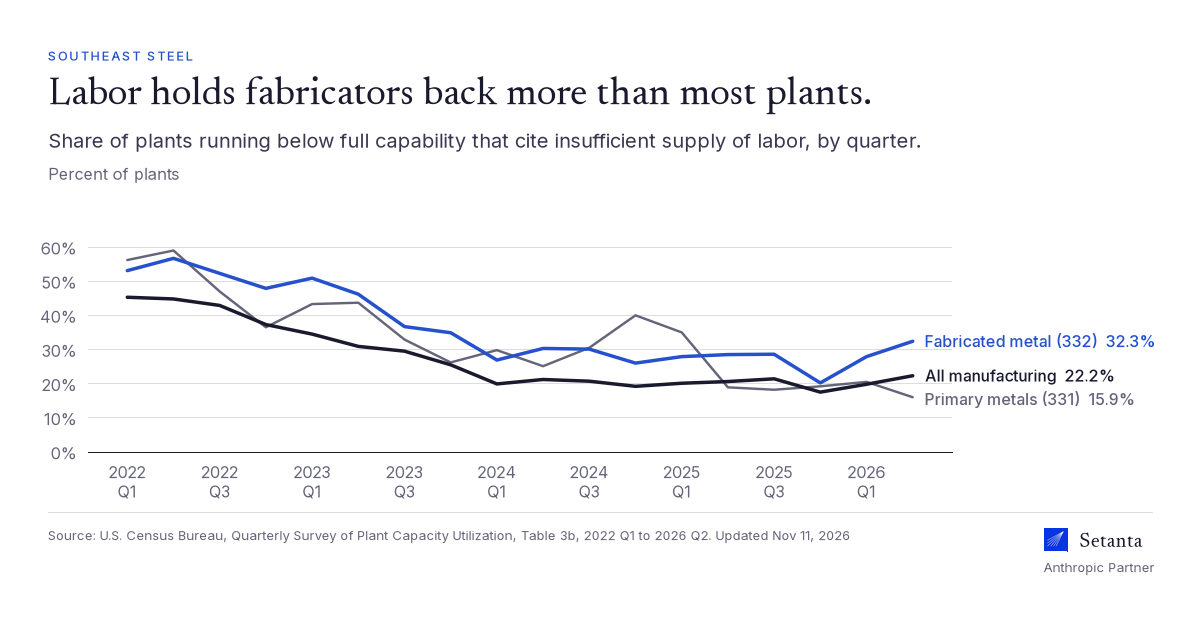
- Fabricated metal plants cite labor shortages more than the rest of manufacturing, 32.3% against 22.2% in 2026 Q2 (Census QPC).
Where the sites are
The work is spread across nine states.
Census County Business Patterns counted 1,663 metal service center sites and 761 structural steel fabricator sites in these states in 2023, 19.3% and 22.2% of U.S. sites in those industries.
Sites and employment, nine states, Census County Business Patterns 2023.
Metal service centers and other metal merchant wholesalers (423510)
- Sites
- 1,663
- Share of U.S. sites
- 19.3% of 8,608
- Employment
- 27,835
Fabricated structural metal manufacturing (332312)
- Sites
- 761
- Share of U.S. sites
- 22.2% of 3,434
- Employment
- 24,933
Iron and steel mills and ferroalloy manufacturing (331110)
- Sites
- 78
- Share of U.S. sites
- 21.7% of 359
- Employment
- 16,652
| Industry (NAICS) | Sites | Share of U.S. sites | Employment |
|---|---|---|---|
| Metal service centers and other metal merchant wholesalers (423510) | 1,663 | 19.3% of 8,608 | 27,835 |
| Fabricated structural metal manufacturing (332312) | 761 | 22.2% of 3,434 | 24,933 |
| Iron and steel mills and ferroalloy manufacturing (331110) | 78 | 21.7% of 359 | 16,652 |
These are mostly small sites. The average service center site has 16.7 employees, and the average fabricator site has 32.8. Only 121 service center sites (7.3%) and 127 fabricator sites (16.7%) have 50 or more employees at that location (CBP 2023 size classes). A company can run several sites, so a site count is not a company count.
Fabrication grew while distribution consolidated. From 2019 to 2023, fabricator sites rose by 32 (+4.4%, from 729 to 761). Service center sites fell by 63 (-3.7%, from 1,726 to 1,663). Mill sites fell by 8 (from 86 to 78). (Census Data API, CBP 2019 and 2023)
The work is spread out. Service centers and fabricators sit in 157 counties, and the top 10 counties hold only 33.3% of sites. The largest clusters are Miami-Dade, FL (108 sites), Broward, FL (82), Mecklenburg, NC (70), Hillsborough, FL (66) and Jefferson, AL (57). (CBP 2023 county file)
Company size
Mid-size firms carry a large share of the people.
A small site and a small company are different things. Firms with 50 to 499 employees are a modest share of firms and a large share of workers.
Share of U.S. employment in firms with 50 to 499 employees, 2022.
- 50 to 499 employees
- Other firm sizes
Metal service centers
Under 20: 17.1%. 20 to 49: 15.1%. 50 to 499: 32.2%. 500+: 35.6%.
Structural steel fabricators
Under 20: 11.8%. 20 to 49: 15.7%. 50 to 499: 35.3%. 500+: 37.2%.
In the Census Statistics of U.S. Businesses for 2022, firms with 50 to 499 employees break down this way.
Service centers: 568 of 6,257 U.S. firms (9.1%), employing 45,406 of 141,114 workers (32.2%).
Structural fabricators: 415 of 3,097 U.S. firms (13.4%), employing 37,953 of 107,516 workers (35.3%).
In these nine states, the state file counts 135 service center firm-state pairs and 43 fabricator firm-state pairs in the 100 to 499 employee band, plus 219 and 192 in the 20 to 99 band. A company with locations in two states is counted in both, so these are not unique company counts. (SUSB 2022, state by 6-digit NAICS)
We focus here because a mid-size company has to run the same order desk, scheduling board and dispatch as a much larger one, without the same depth of back-office staff. The public data cannot measure that directly. It is the question that brought us to this report.
Plant capacity
Orders come first. Labor keeps coming second.
The Census plant capacity survey asks plants running below full capability why. In 2026 Q2, orders lead everywhere. For fabricated metal, labor is the reason that does not go away.
| Reason cited | Fabricated metal (332) | Primary metals (331) | All manufacturing |
|---|---|---|---|
| Insufficient orders | 68.7% | 57.7% | 67.1% |
| Insufficient supply of labor | 32.3% | 15.9% | 22.2% |
| Insufficient supply of materials | 10.6% | 30.1% | 11.3% |
| Equipment limitations | 10.7% | 22.9% | 11.5% |
| Logistics/transportation constraints | 1.9% | 1.0% | 3.5% |
Orders are the top reason in every column. Labor is the persistent second for fabricators. Fabricated metal plants cited labor more often than all manufacturing in 18 of 18 quarters from 2022 Q1 to 2026 Q2, averaging 36.4% versus 27.3%.
Primary metals figures have wide standard errors. Labor, for example, is 15.9% plus or minus 7.2 points. The quarterly file in the download keeps the standard errors, and we do not treat a wide error as a precise reading.
Architectural and structural metals plants (NAICS 3323) averaged 50.4 hours of operation per week in 2026 Q2, versus 66 for all manufacturing, at 83.9% utilization. (QPC Table 1, 2026 Q2) When the shop runs about one shift, an hour lost waiting on a drawing, a quote or a material confirmation is hard to get back.
The Fifth District
Suppliers are slower, and backlogs are thinner.
The Richmond Fed survey is all manufacturing in its Fifth District, not steel alone, and not our nine states. It is still the monthly read closest to home.
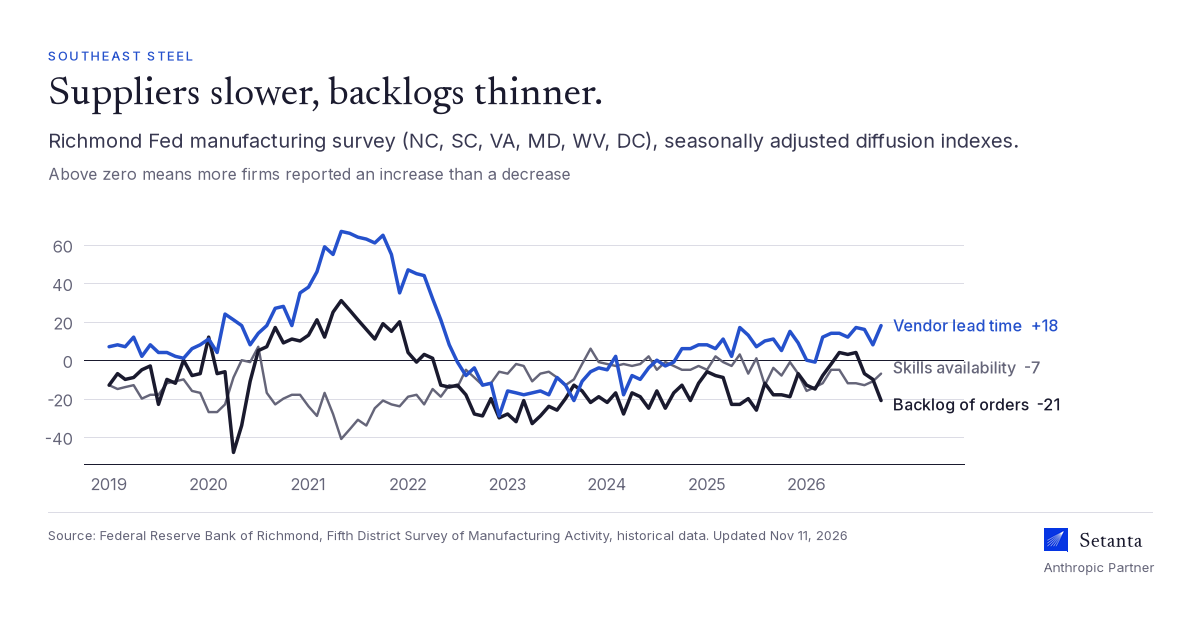
The Fifth District is Maryland, North Carolina, South Carolina, Virginia, West Virginia and DC. We are based in North Carolina. In October 2026 the seasonally adjusted indexes, from the historical file, read:
- Vendor lead time: +18, the highest reading since May 2022.
- Backlog of orders: -21, the lowest since July 2025.
- New orders: -8. Availability of needed skills: -7.
- In 5 of the 10 months of 2026 so far, lead times rose while backlogs fell.
For a service center or a fabricator, customers want a firm date while their own suppliers are slower to give one. The person who answers the phone and builds the quote is the one in the middle.
Hiring
The frontline turns over fast.
In 2025, fabricators in these nine states with 50 to 249 employees made about 50 hires for every 100 jobs. The precise rate in the table is 49.5.
Hires per 100 jobs by firm size, nine states, 2025.
- Architectural and structural metals (NAICS 3323)
- Metal wholesalers incl. service centers (NAICS 4235)
0 to 19 employees
20 to 49 employees
50 to 249 employees
250 to 499 employees
500+ employees
| Firm size | Architectural and structural metals (3323) | Metal wholesalers, including service centers (4235) |
|---|---|---|
| 20 to 49 | 48.4 | 40.0 |
| 50 to 249 | 49.5 | 38.5 |
| 250 to 499 | 44.8 | 41.7* |
| 500+ | 43.4 | 34.8 |
*For metal wholesalers at 250 to 499 employees, 6 of 36 state-quarter hire cells are not published. The rate uses the published cells only. We do not fill the missing ones.
New hires also start well below the people they join. At metal wholesalers with 50 to 249 employees, new hires' average monthly earnings were 58% of those of workers in stable jobs. At fabricators of that size, 74%. Every new hire has to learn the product codes, the customers and the shop's habits. In our view, that is where turnover lands on the order desk.
The frontline, in May 2025, from BLS OEWS for NAICS 3323 and 3324 combined (515,010 jobs): welders, cutters, solderers and brazers are the largest role, at 70,020 jobs (13.6%). Cost estimators, the people who price the work, number 6,450, about one for every 10.9 welders. Sales representatives number 11,900. Production, planning and expediting clerks number 4,080. BLS no longer publishes a separate staffing profile for metal service centers, so we cannot show the same split for distribution. 3323 is published together with 3324, which covers boilers, tanks and containers, and the profile is national.
Public company filings
What large peers say about speed, and about AI.
The companies in these filings are much larger than a 50 to 600 person firm. We read them as the standard a customer gets used to, and as a record of what boards are willing to write down.
Reliance says, in its 2025 Form 10-K: "In 2025, we delivered approximately 40% of our orders within 24 hours" and "over 90% of our sales orders received from repeat customers." Reliance is far larger than the companies this report is about. We do not read those sentences as a picture of a 50 to 600 person firm.
Large steel peers whose 10-K mentions artificial intelligence, by year filed.
- Mentioned artificial intelligence
- Peers filing a 10-K
We searched the 10-K filings of six large public steel companies (Reliance, Ryerson, Olympic Steel, Commercial Metals, Steel Dynamics and Nucor) in SEC EDGAR. None mentioned "artificial intelligence" in 10-Ks filed from 2019 through 2024. Four of six did in 2025, and three of the five that have filed in 2026 so far. Olympic Steel has no 10-K in the 2026 window, which runs through November 11, 2026.
The passages we read are mostly about risk: AI-assisted cyberattacks, data-center demand for power, and stakeholder expectations. One peer notes AI's potential to create operational efficiencies (Ryerson 2025 10-K, Commercial Metals FY2026 10-K). In these filings, AI is on the risk list. It is not described as something running the order desk.
The limit
What public data cannot tell you.
We want the limit of this report to be as plain as the counts. Three things we looked for are not in any public file we found.
- Quote turnaround. How many hours or days a service center or fabricator takes to answer a request for quote, and how many quotes are lost because the answer came too late.
- Order-desk workload. How many calls, emails and drawings one inside sales rep or estimator handles in a day, how many get re-keyed by hand, and how often an order has to be corrected after it is entered.
- Remakes and errors. How often a cut list, a drawing revision or a material substitution causes rework.
That is where we think the hardest part of the day sits. The public numbers show the pressure around it: fabricators hiring about half their headcount each year, labor that limits output more than in most of manufacturing, suppliers getting slower, customers who have gotten used to next-day service from a much larger peer, and about one cost estimator for every 11 welders. The work that connects the phone, the quote, the saw and the truck is the part nobody counts.
If you run a service center or fabricator in these nine states and you have measured any of this in your own shop, we would like to compare notes.
Tables
Download the data.
Fifteen tables, as CSV. These are our derived tables. The raw Census, BLS, Federal Reserve and SEC files are not on this site, and neither is an API key.
We license the derived tables under CC BY 4.0. The government data they are built from is in the public domain. EDGAR text is public. Please cite Setanta and the upstream source if you reuse a table.
- Establishments by state, 2023 (CSV)
Metal service centers (NAICS 423510), structural fabricators (332312) and iron and steel mills (331110), for the nine states and the U.S.
- Nine-state summary, 2023 (CSV)
Sites, share of U.S. sites, employment, sites with 50 or more employees, and employees per site.
- Change in sites, 2019 to 2023 (CSV)
The same three industries. 2023 API totals match the flat file.
- Counties, 2023 (CSV)
Service center and fabricator sites by county. County size bands are mostly withheld, so this file is totals only.
- Firms by enterprise size and state, 2022 (CSV)
Firm-state pairs, not unique companies. A firm in two states is counted in both.
- Nine-state firm-size summary, 2022 (CSV)
Firm-state pairs in the 20 to 99, 100 to 499 and 500-plus bands.
- U.S. firms with 50 to 499 employees, 2022 (CSV)
The closest exact public cut to a 50 to 600 person company. National.
- U.S. employment share by firm size, 2022 (CSV)
The size bands behind the employment chart. National.
- Why plants ran below full capability, 2022 Q1 to 2026 Q2 (CSV)
Census QPC Table 3b, with standard errors. National. Reasons are multi-select.
- Richmond Fed manufacturing indexes (CSV)
Fifth District, all manufacturing, not steel alone. Seasonally adjusted current conditions.
- Quarterly workforce rows, 2025 (CSV)
State-quarter cells for NAICS 3323 and 4235. 4235 includes coal and other mineral wholesalers. 3323 includes architectural metal.
- Hires by firm size, 2025 (CSV)
The summary on this page. For metal wholesalers at 250 to 499 employees, 6 of 36 state-quarter hire cells are not published.
- Selected occupations by state, May 2025 (CSV)
BLS OEWS for the nine states. All industries, not steel only. BLS no longer publishes a metal service center profile on its own.
- National staffing, NAICS 3323 and 3324 combined, May 2025 (CSV)
Architectural and structural metals, plus boilers, tanks and containers. National only.
- 10-K term counts, six public peers, 2019 to 2026 (CSV)
Counts by year filed. 2026 runs through November 11. Olympic Steel has no 10-K in that 2026 window.
Setanta
Why we started with the public files.
This page reads public data. It is not a client result, and we don't have a steel client to report yet.
Setanta is an Anthropic Partner in Wilmington, North Carolina. We help privately run industrial companies of 50 to 600 employees put Claude to work on the part of the day their best person already does well. Steel service centers and fabricators are where we are starting.
The free Operating Diagnostic looks at how your team works today and where Claude would move your numbers first. If it is not the right time, we say so. More on the work itself is on AI for steel service centers, AI for metal fabricators and how we work.
How we counted.
Every figure on this page is our reading of a public file. It is not a survey, and it does not describe any one company.
The nine states are Alabama, Florida, Georgia, Kentucky, Mississippi, North Carolina, South Carolina, Tennessee and Virginia, unless a chart says otherwise. The Richmond Fed survey uses its own Fifth District: Maryland, North Carolina, South Carolina, Virginia, West Virginia and DC. The plant capacity survey, the OEWS industry profile and the detailed SUSB size bands are national.
County Business Patterns counts establishments, which are sites. Statistics of U.S. Businesses counts firms, which are companies, by total employees. A state SUSB count includes a multi-state firm once in each state, so a nine-state sum is firm-state pairs.
We care about companies of roughly 50 to 600 employees. Census size bands break at 499 and 749, so the closest exact public cut is 50 to 499. The workforce indicators use 50 to 249 and 250 to 499. There is no public 50 to 600 band.
Sites with 50 or more employees are the exact residual after the published bands under 50. That residual is not an estimate. Mills are missing a small band in every one of these states, so we do not publish a 50-or-more figure for mills. Where Census withholds a cell, we say so and we do not fill it.
NAICS 4235, used for the hire rates, is wider than service centers. It includes coal and other mineral wholesalers. NAICS 3323 includes architectural metal as well as structural fabricators. The staffing profile combines 3323 with 3324.
The files were current as of November 11, 2026. SUSB 2022 is the latest SUSB year posted. County Business Patterns here is 2023. The plant capacity survey runs through 2026 Q2. The Richmond Fed month is October 2026. The workforce indicators are release R2026Q4, for the year 2025.
- U.S. Census Bureau, County Business Patterns 2023 datasets
- County Business Patterns 2023, state file
- County Business Patterns 2023, county file
- Census Data API, County Business Patterns
- County Business Patterns program
- Statistics of U.S. Businesses 2022 tables
- Statistics of U.S. Businesses 2022, detailed enterprise sizes
- Statistics of U.S. Businesses 2022, state by 6-digit NAICS
- Statistics of U.S. Businesses program
- Quarterly Survey of Plant Capacity Utilization, data tables
- Quarterly Survey of Plant Capacity Utilization, 2026 Q2 workbook
- Quarterly Survey of Plant Capacity Utilization program
- Census LEHD Quarterly Workforce Indicators, latest release (R2026Q4)
- Longitudinal Employer-Household Dynamics data
- BLS Occupational Employment and Wage Statistics tables
- BLS Occupational Employment and Wage Statistics
- Richmond Fed Fifth District Survey of Manufacturing Activity
- Richmond Fed manufacturing survey, historical data file
- SEC EDGAR full-text search
- Reliance, Inc. Form 10-K for 2025
- Ryerson Holding Corporation Form 10-K for 2025
- Commercial Metals Company Form 10-K for fiscal 2026
Gary O'Neill is the founder of Setanta, an Anthropic Partner that modernizes US industrial businesses.